Showing posts with label ancestors. Show all posts

Tuesday, August 12, 2014

Iberian R1b Y-DNA: First Movers in Europe

   The disputed origins of haplogroup R1b, most commonly thought of as Celtic, remains split between Iberia prior to the end of the last ice age and various West Asian locations after the ice age.  A new view on the R1b homeland comes out every year.  With all we know about DNA, shouldn’t we be coming to a consensus?  Typically, I refer to R1b as Celtic to help an audience make the connection between lettered haplogroups and culture or ethnicity.  I also add the caveat that Celtic is a misleading label.   R1b is supergroup of cultures including; Iberian, Gallic, Celtic, Germanic and Scandinavian.  To attribute empires or nationalities to R1b would be foolish, as R1b is tens of thousands of years older than any known empire.

   Perhaps I’m naïve.  I like simple, logical answers.  The earliest publications on R1b described their ancestor R1, entering Europe from central Asia during a warm period about 30,000 – 40,000 years ago.  The last ice age forced R1 to split and take refuge south in Iberia and the Balkans.  Time and separation gave us the mutations R1b in Iberia and R1a in the Balkans.  That split is roughly what we see today in those regions.  That’s clean and simple.  The real world is much more complex.  R1b and R1a were not alone in Europe.  Their interactions with the other major European haplogroups- E, G, I, J and N has to be taken into consideration.  We can’t analyze R1b as if it were in a vacuum.

   Let’s take y-DNA haplogroups out of the picture for a moment.  We know that modern humans survived and flourished in the Iberian refuge during the end of the last ice age, based on mitochondrial DNA studies.  [Could someone please run some y-DNA tests on those samples?]  The tribes in western Europe, whoever they were, had a 1,000 to 2,500 year head start over the tribes in central and eastern Europe on repopulating the continent.  The ice sheets melted and retreated earlier on the west coast than in the rest of Europe.  This gave the inhabitants of the Iberian refuge an advantage – a “first-mover” advantage gained by being the first to move north.  These first-movers gained a land-monopoly.  A tribe with a first-mover advantage and over a 1,000 year head start should have been hard to displace from western Europe.  In other anthropological situations, those original inhabitants are forced into niche locations by invading populations, but very rarely are displaced completely.  What we see on the west coast of Europe, is a very strong R1b presence and no niche haplogroups of a significant age.  From this point of view, either R1b is the original Iberian inhabitant or R1b completely decimated another earlier haplogroup that had a 1,000 year geographical head start.  I like simple.  R1b was in Iberia first.
   Let’s throw some data at the problem.   The R1b haplogroup population is enormous.  The majority fall into SNPs R-P312 (Celto-Iberian) and R-U106 (Celto-Germanic).  There is so much information there that it tends to be noise.  If you want to get to the root of R1b (R-M343), you need to work with the branches that are closest to the root - R-L278*, R-V88, R-M73*, R-YSC0000072/PF6426 and R-L23.

• • R1b   M343
• • • R1b1   L278
• • • • R1b1a   P297
• • • • • R1b1a1   M73
• • • • • R1b1a2   M269
• • • • • • R1b1a2a   L23
• • • • R1b1c   V88
[• • • • • • • • • R1b1a2a1a1   U106 - too far downstream]
[• • • • • • • • • R1b1a2a1a2   P312 - too far downstream]

   I collected 250 records that matched these SNPs or were genetically close by STR haplotype.  These records were mapped based on user-reported most distant ancestor location.


   This is not a connect the dot exercise.  Just because two or more records appear geographically close doesn’t mean that they are genetically close.  These 250 records have to be treated like a network.  If this were Facebook, these folks would be randomly associated through family, business, school or neighbor connections.  These are y-DNA records.  There is a relationship between every pair.  Each pair has a different common ancestor, with a different number of generations to get back to that ancestor.  Here is an example of what that relationship looks like across multiple pairs.  The number represents years back to a common ancestor (TMRCA).


When all of the interrelations are taken into consideration, the group of records can be displayed as a relationship tree of who is older or younger and who is more closely related to whom (phylogenetic tree).


   Now we have who, where, when and how the records are connected.  At this point it does become a connect the dots exercise.  I’ve used a biogeographical analysis to connect very specific sets of dots based on the calculated interrelation of the entire group.


   The R1b genetic family tree has a trunk and many branches.   The trunk of the R1b data is firmly rooted in Iberia.  The main core of the tree stretches along the western Atlantic coast of Europe and branches across Europe and even back into Asia.  The results that I found support the work of the earliest pioneers in the field and conflict with the latest publications.


   Every analysis has its limitations.  The work that I’ve done looks back at the R1b family about 8,000 years.  The scarcity of data only allowed for me to predict the origin of R-L278, which is currently one branch below the main root of R-M343.    I can’t tell where R1b was between the times that R1 split into R1b and R1a, yet.

   In my analysis, I have included R-V88.  They are a curious group of R1b found in Africa and the Middle East.  I will be treating R-V88 in a separate write-up to do justice to a very interesting back migration story.  The R-V88 article can be found here.

Reference:

Maglio, MR (2014)  Biogeographical Evidence for the Iberian Origins of R1b-L278 via Haplotype Aggregation (Link)

Wednesday, January 29, 2014

Getting More from Your Genetic Testing Results: Y-DNA Mapping

   Y-DNA testing has only been around for about 15 years and can tell us about our direct paternal ancestry.  It is sometimes criticized for only being able to tell us about a small portion of our genetic history.  I think the critics forget that our mothers have fathers and there are a number of ways to obtain male test subjects to expand Y results across the entire family tree.  In the last few years, there has been a brighter spotlight on autosomal testing and its ability to test a larger portion of our genes.  This may have diverted research attention.  Relatively speaking, y-DNA is still in its infancy and there is much more to be learned.  In addition to our deep ancestral origins dating back over 10,000 years, we should be able to identify our old world homeland and our nomadic ancestor’s migration routes.  It is meaningful to know not only where they lived, but also when they lived to give us clues to their part in history.

   My closest genetic cousins and I share a common ancestor over 1,100 years ago.  With that many years between us, I didn’t spend a lot of time looking for a common surname.  For the last four years, I’ve been working with y-DNA to determine what can be learned beyond cousin matches and distant origins.  I originally tested with the Genographic Project and then transferred my results to Family Tree DNA for an upgrade.  In the time since getting my upgrade to 67 markers, I have received only one match.  This is due to my haplotype being somewhat rare and not a reflection of Family Tree DNA’s ability to provide matches.  I learned that I was part of haplogroup G, from the Caucasus Mountains.   I didn’t learn anything about how the ancestors of my Italian family traveled from Western Asia to Italy.
   I needed to find more cousin matches than the client base that had tested with FTDNA.  Ancestry.com allowed me to enter my y-DNA markers into their DNA section.  I compared my haplotype against the database at Sorenson Molecular (SMGF.org).  I also tried Genebase.com and any other place I could find.  I didn’t locate any cousins.  I did get a good education on what is out there for DNA companies and services.  FTDNA allowed me to transfer my results to Ysearch.org, a free public DNA matching service that they provide.  Ysearch provided much more flexibility.  Where FTDNA would only show me matches with a genetic distance of seven or less, Ysearch allowed me to select the genetic distance.  Without the genetic distance restrictions, Ysearch showed me hundreds of very distantly related cousins.  I’d rather have distant than none.  FTDNA is not trying to be difficult.  They are trying to be realistic and keep matches within genealogical timeframes.  I just needed more.
  While not used consistently, one of the best features of Ysearch is its ability to present the most distant known paternal ancestor (MDKPA) and their origin.  So now, I had cousins and their ancestral origins.  The greater the genetic distance, the closer I got to the Caucasus Mountains.  I mapped my closest cousins and their pushpins created a line from the Alps to the North Sea, directly along the Rhine River.  This was a pattern.  I like patterns.  There is usually a scientific reason for a pattern.

Figure 1 – Mapping Ancestral Origins

   I’ve run a few hundred genetic mapping exercises on the majority of Y haplogroups.  The patterns are consistent.  Our ancestors traveled along rivers and coastlines.  They skirted mountain ranges and crossed bodies of water.  There is always a flow to the patterns, but the science and the why were still missing.  I’ve always been interested in early Eurasian history and have tried to associate it to the patterns in the maps that I generated.  Some maps have places and dates that connect well to notable events.  Other maps raise more questions than answers.  Genetic tests and history alone were not making a complete picture.  I needed to add population genetics, migration models, anthropology and evolutionary biology to my knowledge base.
   Take any  two people on the planet, compare their DNA and you can calculate, approximately, how far back in time their common ancestor lived – time to most recent common ancestor (TMRCA).  Our ancestors were nomadic and traveled about 25 to 30 km per generation or roughly 1 km/year on average.  If a common ancestor lived 300 years ago, then that person’s descendants may have migrated 300 km from the geographic origin of that ancestor.  In the figure below, d1 and d2 represent the origins of two known y-DNA genetic records.  The circles show the distance their ancestors may have migrated.  The intersections are the potential locations of their common ancestor.  In this case, there are two intersections, a1 and a2.  More y-DNA records are required to figure out which intersection is correct.

Figure 2 – Distance to Most Recent Common Ancestor (Bilateration)

   The genetic analysis that I have developed is similar to a navigation technique.  Radio navigation uses two or more beacons with known locations and a measurement of the time it takes to receive a signal from each.  The time is converted to a distance.  A current location can then be identified.  In my method, the “beacons” are the ancestral geographic origins. The “signal” is the TMRCA, measured in years, converted to a distance by multiplying the average migration rate – creating a distance to most recent common ancestor (DMRCA).  A location for the common ancestor can then be figured out by looking at the intersections.  Multiple y-DNA records are needed to determine migration direction and geographic origins of a related set of genetic cousins.  The science is starting to take shape.
  I am G-Z726, which is a subgroup of G-Z725.  At Ysearch or on an FTDNA project you may still see an older naming convention - G2a3b.  As an example, let’s look at 18 of my closest genetic cousins – haplogroup G-Z725, (DYS388=13).  TMRCA data is generated using Dean McGee’s Y-Utility.  The output is turned into a phylogenetic tree and the DMRCA is calculated. 

Figure 3 - Phylogenetic Tree - G-Z725 Sample

Each distance is used to draw a circle that represents the migration range of that ancestral line.  My range (MAG) and the range of my next closest cousin on the tree (BAB) create two intersections on the map.  One point is in Africa and the other is in Eastern Europe.  

Figure 4 - Intersection of MAG and BAB

By adding the range of cousin EBE, the correct intersection representing common ancestor 7 (CA7) is identified.  Pairs of records are mapped to continue the analysis.

Figure 5 - Intersection of BIR and RUF

BIR and RUF are another example and they identify common ancestor CA3.  Each record is added until all common ancestors are identified. 

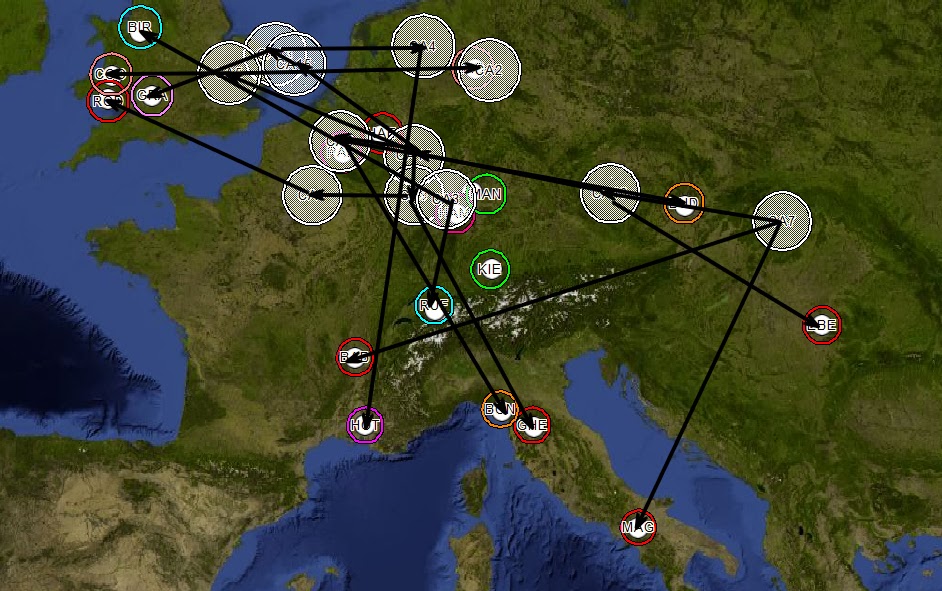
Figure 6 - Common Ancestors Mapped

Connections are drawn based on the phylogenetic tree.

Figure 7 - Phylogenetic Tree Superimposed

Then for simplification, the migration flow is generalized.  Based on the phylogenetic analysis, common ancestor 7 (CA7) is the most distant common ancestor (MDCA) of samples in this example.  The western migration flow has a slight correlation to the Danube River and the North/South migrations have a strong correlation to the Rhine River.  Early attempts at direct mapping of genetic data (Fig. 1) gave similar results based on TMRCA alone.  There was no corroborating evidence of directionality or definitive proof of MDCA.  

Figure 8 - Generalized Migration Flow - G-Z725

   The new methodology that I have developed shows ancestral origins and migration direction.  I call this method biogeographical multilateration (BGM).  It is the geographical distribution of y-DNA data based on multiple distance measurements from reference positions. 
   This method also has the potential to identify the location of a DNA sample when the origin is unknown. For one of my clients, I identified that his paternal ancestor that had immigrated to the United States may have anglicized their name.  The previous name was German and that surname was found predominantly in central Germany.  Applying biogeographical multilateration to my client’s y-DNA results, while leaving the origin as an unknown, indicated a continental European origin within 200km of the city with the highest surname density.
   In the referenced paper, the example haplogroup, I-L22, has an approximate correlation to the Norse/Viking invasions of Britain and identifies a Frisian coast staging area.

Figure 9 - Generalized Migration Flow - I-L22

  We are still in the infancy of what we can learn from y-DNA.  My BGM analysis has room for refinement.  There is enough science out there to help us.  New research is being done at the aggregate population level.  We can apply elements of that research to the individual level.  Biogeographical multilateration has the potential to fill the gap in our knowledge between genealogical records and deep haplogroup roots.  This new tool can give us old world ancestral origins, migration flow and historical timeframes.
   I needed to learn more about my DNA and my origins.  The big testing companies haven’t filled the knowledge gaps that exist.  They are in the business of providing quality test results.  The analysis and tool creation is falling on the shoulders of “citizen scientists”.  Sometimes, you just have to do it yourself.

Reference:

Maglio, MR (2014)  Y-Chromosome Haplotype Origins via Biogeographical Multilateration (Link)

The Shape of Words to Come


Monday, March 25, 2013

The DNA of Thomas Jefferson: [Insert Shocking Title Here]

   I’ve been creative with the titles of my articles in the past. It is the first thing people see and it better be eye catching. It’s been said that I'm ‘intentionally provocative’. I enjoy writing about topics that make people think. I draw the line at faulty logic. Many times, I'll draw conclusions from circumstantial evidence, but I always strive for a logical argument.

   Thomas Jefferson was part of the rare y-DNA haplogroup T (formerly K2) and much has been written about his genetics. Not everything written has been logical in its assumptions. Sometimes the story lines misinterpret the underlying science.


“Was Thomas Jefferson the first Jewish President?”

“Thomas Jefferson was Phoenician.”

“If Jefferson was Phoenician, then Charlemagne was also.”

“Thomas Jefferson could have recent origins in the Middle East.”

“Thomas Jefferson’s DNA traced back to Egypt.”

   In these situations the writers took a single data point and ran with it out of context.

   When we look at Jefferson’s DNA and compare it to available records, we only get a handful of matches that don’t tell a complete story. Let’s look at the first headline – was Jefferson Jewish? He didn’t practice Judaism and he wasn’t raised Jewish. He does have one genetic cousin who is a Moroccan Jew, but you have to go back about 2,000 years to find a common ancestor. While haplogroup T does have origins in the Middle-East, I wouldn’t say that it is definitely a Jewish haplogroup. If Jefferson were J1b2, there would be a stronger case tying him to the kohanim Jewish paternal lines. Jefferson also has a Belgian genetic cousin. Perhaps the headline should have been – Was Thomas Jefferson the first Belgian President? Not that exciting. Probably wouldn’t have sold very well.

   Thomas Jefferson was a Phoenician! There are many articles attributing this statement to Spencer Wells as part of his In Search of Adam program in 2005. I can’t find one quote that actual has Wells saying this. In fact in 2008 Wells argued that the Phoenicians were haplogroup J2. Jefferson’s haplogroup T is found in the same places and at the same times as the Phoenician Mediterranean colonies. This may indicate that Jefferson’s ancestors travelled with the Phoenicians as a peer or as a slave. I don’t think that ethnicity by association works.

   If Jefferson was a Phoenician, then so was Charlemagne. This is just plain and simple poor logic and a misunderstanding of genetics. As I mentioned, it doesn’t appear that haplogroup T is Phoenician. While Jefferson may be a descendant of Charlemagne, he is not a direct male descendant. You really need to be a direct male descendant to prove that an ancestor has the same y-DNA. One sample would never be enough to prove Charlemagne’s DNA. Multiple descendant samples and very strong genealogies are required to come close to determining an ancestor’s DNA. You never know where a non-paternal event may pop up.

   Could Jefferson have recent origins in the Middle East? This writer never actually defines recent. We are left to wonder if the Jeffersons lied on their Naturalization applications. Based on ‘time to most recent common ancestor’ calculations, I’d put Jefferson’s ancestors in the Middle East about 3,000 years ago. I guess that’s fairly recent compared to the age of the universe.

   Jefferson’s DNA traced to Egypt! One record match does not make an origin. That one Egyptian genetic cousin actually clusters better with other Moroccan records. This could indicate a back migration from Morocco to Egypt for that one person. A rule of thumb when determining origins is to find clusters of records. Jefferson does have a cluster on either side of the Strait of Gibraltar. This provides a strong argument that Jefferson’s ancestors came through that region and perhaps loitered there for a while. That doesn’t make it his origin.

   How should we define Jefferson’s origins? It is important to define origins with context. Where in Britain did the Jeffersons come from? One biographer puts Jefferson’s family origins in Wales. Jefferson’s closest British genetic cousin comes from Yorkshire and the Jefferson surname has the highest distribution in Yorkshire. We are still talking about a single point of reference, so I won’t fall into the same trap and pronounce Thomas Jefferson a Yorkie. I can say that it appears that the Jeffersons were British and that the family had been in Britain for at least a 1,000 years. There’s just not enough data to be more certain.

   Jefferson’s tribal DNA does leave a sparse trail of breadcrumbs across Europe in the 1,500 to 2,000 years ago range. There are genetic matches that become increasingly more distant in Belgium, France and Spain. We could connect-the-dots and we probably wouldn’t be far off the migration path. For Jefferson’s European origins, we might say his ancestors were Iberian. If we go back another 500 years, the picture changes to a culture that traveled the Mediterranean. The genetic breadcrumbs are in Morocco, Sicily, Cyprus, Egypt and Turkey. We could talk about Jefferson’s haplogroup T origins. A cluster of data suggests a southern Arabian Peninsula origin about 8,000 years ago.


   If we continue backward in time, Jefferson’s ancestors came from East Africa just like everyone else on the planet. Which ‘origin’ you choose for Jefferson is completely up to your specific agenda. I use genetic genealogy to get a better understanding of the world that we live in and the things we have in common as one species. We may learn through DNA that our ancestors sacked Rome or pillaged the coast of England. That’s history, that’s fascinating, but that’s not who we are today. Unless you personally choose to embrace that history. Jefferson’s distant ancestors may have been Jewish, Phoenician or Egyptian, but that’s not who he was.

   We shouldn’t persecute for the sins of our ancestors or sit on the laurels of their accomplishments. We need to keep moving forward in a positive direction.

#gDNA


Monday, August 20, 2012

The DNA of John Cutter West: Connected and Disconnected


   Bill West, author of the blog series ‘West in New England’, has been writing about his ggg-grandfather, John Cutter West, for over five years.  Bill calls him ‘The Elusive John C.’
                                               

   Some genealogies connect John Cutter West as the son of Paul West and Hannah Crowell of Liverpool, Nova Scotia.  It has also been suggested that he could be the grandson of Josiah West and Elizabeth Griffith of Plymouth, MA.  Both Paul and Josiah are descended from Francis West of Salisbury, England who immigrated to Duxbury, MA.

   Bill West completed a 37-marker y-DNA test and his results came back as haplogroup J2.  Multiple descendants of Francis West have also been tested.  Their results indicate that Francis West was a member of haplogroup R1b.  Bill is related to Francis West in the same way that J2 is related to R1b, but you have to go back 40,000 years ago to find that family connection rather than 400 years.  DNA results can be a double-edged sword.  They can prove your connection or just as easily disprove your assumptions.

   One of the most exciting events in DNA testing is when you receive your results showing multiple matches with your surname.  If you have already researched a dozen generations, the test is confirmation.  If you are just getting started, the test connects you with cousins.  Or, if you were adopted, getting matches to multiple records with a surname you weren’t expecting will lead you on a path of discovery.  In a survey of major DNA databases, Bill’s genetic record didn’t have any close matches.  The wonderful part of y-DNA testing is the ability to dig deeper.

   Here is what we do know about Bill’s DNA.  Haplogroup J2 has origins in Mesopotamia about 18,500 years ago and it is associated with speakers of the Semitic languages.  The J2 haplogroup is widespread around the Mediterranean with connections to both Arabs and Jews.  Bill’s haplotype, the 37-markers from his test, are a genetic fingerprint that can help us find his tribe.

   I've developed a tool, TribeMapper®, which allows me to take a haplotype record and map ancestors across time and place.  One of the first clues we find is that Bill’s haplogroup is more uniquely related to subgroup J2b2.  Only a test looking for SNP M241 can prove J2b2 for certain.  My next step is to map the DNA to determine which J2b2 ethnicity Bill belongs.

   As I look at slices of time, 4,500 years ago Bill’s ancestors were in places like Turkey, Armenia, Syria and Saudi Arabia.  If I look at a branch of Bill’s tribe at about 3,000 years ago, I see a distinct correlation with locations like Cyprus, the coasts of Italy and Spain and the islands of the Azores.  These places match up with the colonies of the Phoenicians.  Phoenicia had origins in what is modern day Lebanon.  They were known for their extensive maritime trading culture. Phoenicians were not only sea travelling merchants with colonies around the Mediterranean, they had trade routes across Europe as well.  Bill’s closest DNA matches were part of a Phoenician branch that headed into central Europe.


   Looking at a period from 1,300 (Bill’s closest match) to 2,000 years ago, we see a pattern of migration into what is modern day Germany and more specifically those genetic connections appear in cities in the Hessen region.  Research into John Cutter West gives the appearance that he has English origins.  The DNA trail ends in southwest Germany.  We are still left with the fact that there are not enough DNA records to fill the gap between now and 1,300 years ago.  It is possible that Bill’s ancestors migrated further, from Germany to England.

   Now it’s time to move from facts to theory.  The closest DNA matches indicate a connection to the Hessen region of Germany.  An avenue worth investigating is whether one of those ancestors was a Hessian soldier that stayed in America after the Revolution.  Perhaps the reason there are no records of John Cutter West before his 1827 marriage record is that he was born under a different name, a more German sounding name.

   Sometimes DNA can help us make all the connections.  In the case of Bill West, he is still disconnected over the last 1,000 years.  That’s a big space of time with plenty of questions.  More folks are being tested every day and the DNA databases are growing.  Today the data shows that Bill has deep Phoenician roots and that those ancestors settled in the German region of Hessen.  Time and more data will help revise and refine this picture of Bill’s tribe.

© Origin Hunters & OriginsDNA

Friday, August 10, 2012

Genealogy Gold: McCarthy DNA


   Sometimes in genealogy, we go for the gold.  We try to figure out how we are descended from Presidents, royalty or other famous people.  In the US, if your last name were Adams, you might ask if you are related to the second President.  With a surname like Stewart/Stuart you could try to research back to UK royalty.  If you are Irish, some of those royal names are O’Neill, O’Brien or McCarthy.

   The last King in Ireland died in the 1600s.  For many of us it is incredibly difficult to go back beyond the 1800s in our Irish genealogy research.  The lack of paper records makes finding that connection to Irish royalty challenging.

   DNA is the next best answer to the lack of records.  Both regional and surname projects can collect enough genetic samples to build family trees.  Not in the same sense as child - father - grandfather etc., more in a phylogenetic sense.  A phylogenetic tree will show how individuals connect back to common ancestors and in turn, those common ancestors trace further back to another common connection.

   I have McCarthy ancestry and like everyone else I have researched as much as possible about one of my surnames.  Historically the surname comes from Carthaigh or Carthach, an 11th century King of Ireland and ancestor of the McCarthy Kings of Desmond (current day Cork and Kerry).  His son, Muireadhach, was the first to take on the Mac Carthaigh name.  Literally the ‘son of Carthaigh’.  In names like O’Neill or O’Brien, the O’ means grandson or descendant.

   Time to go for the gold.  How am I related to the Kings of Ireland?  Which DNA haplogroup do the McCarthys belong?  First, I found that a surname project existed on Family Tree DNA.  Then I started analyzing the data on the McCarthy Surname Study DNA site.  Nothing is ever simple.  There are six different haplogroup represented in the group, E1b, I1, I2a, I2b, R1a and R1b.  There are also four different R1b subgroups.  The site has R1b divided into Group A (SNP R-L21), Group B (SNP R-P314.2), Group C (SNP R-M222) and Group D (misc. others).  I would expect there to be multiple R1b subgroups as it is the most numerous haplogroup in Western Europe.

   Like the Olympics, there can only be one gold medal winner in this event.  Only one (or none) of these groups can be related to the original Carthaigh.  There are many reasons why there are multiple McCarthy haplogroups.  The Administrator of the McCarthy site, Nigel McCarthy, is well aware that there could be non-paternal events and has posted some possible situations where a McCarthy name could have arisen:

“•Soldiers, serfs, or slaves or hostages taken in battle and who remained with their captives, all under the tutelage of a McCarthy king, chief of chieftain, adopting this surname.
•Rape of McCarthy womenfolk by invading forces.
•Other illegitimacy.
•Adoption (e.g. by a chieftain of a sister’s orphaned children).
•Raiders such as Vikings being absorbed, a century or two after they settled in Ireland,  into the group which became the McCarthy family as they became “gaelicised”.
•Stepsons taking the McCarthy name of their new stepfather (early deaths of husbands or wives, and thus remarriages, were common).
•The sons of Cárthachs other than he who died in 1045 forming their surnames in a similar manner (although there is no explicit evidence of this).”
-source McCarthy Surname Study - Background

   Which genes are the royal McCarthy genes?  Other projects have been able to analyze DNA records and come back with an announcement that they have identified the haplotypes of Genghis Khan or Niall, ancestor of the O’Neill kings.  The same methods should work for the McCarthys.  If we consider the McCarthy DNA records as a random sample representing the larger population, then the groups with the larger number of records are more likely to be part of the royal group.  A wealthier family would have had more resources to provide for larger families, allowing for more descendants.

   Looking at the McCarthy site, haplogroup R1b Groups A and B have the most records.  At first glance, the other haplogroups seem to be ruled out for lack of representation.  An analysis of the haplotypes within these haplogroups gives us additional evidence.  The E1b group shows a clear pattern of migration from Greece through Italy, Germany, England and Scotland before arriving in Ireland.  This is consistent with the Alexandrian origin of E1b and the timing fits with Rome’s incursion into the region.


   Haplogroup I2b shows a migration from the Danube River region through Germany, England, Scotland and into Northern Ireland.  They appear to have arrived before the Romans.  Haplogroup R1a originated from Eastern Europe and took a different path via Normandy, Devon/Cornwall, into Ireland through Cork.  Their timing fits the Norman invasion of Ireland about 900 years ago.

   If we calculate the time to most recent common ancestor (TMRCA) for Groups A and B, we see that within each group they are closely related.  For each group, their common ancestor lived about 1,000 years ago, which coincides with Carthaigh’s timeframe.  Comparing the two groups against each other shows a common ancestor over 2,800 years ago.  Both groups have the right ancestral timing.  Group A has DNA that is associated with Southern Ireland and an analysis across a larger R1b tribal haplotype indicates that this group entered Ireland over 2,600 years ago.  The same analysis of Group B indicates that they entered Ireland about 500 years later.  Group A has been in Ireland longer and occupy the ancestral region of Desmond.


   So far, we have circumstantial evidence.  We need something more concrete.  We can get a clue from the historic royal genealogies.  The McCarthys were more than just a royal family.  They were a dynasty.  Along with the surname McCarthy, there were also the Sullivans, Callaghans, Keeffes, Donoghues and Donovans that made up the larger related genetic dynasty.  Looking at each group in the context of the larger genetic pool of records and surnames shows that Group A has a close DNA connection to the dynastic surnames and Group B does not.  This method was a key factor in the O’Neill project.

   The evidence points to Group A as the descendants of the royal McCarthys.  The haplotype for Carthaigh is slightly different from the modal for the McCarthy Project Group A.  Considering the dynastic records, makes the values of DYS576=19 and DYS442=13.


   The pedigree of Carthaigh’s ancestors borders on mythology.  Many Irish pedigrees trace back to Milesius of Spain as the father of the Irish people.  Historians found it easy to dispute these claims as these records often are full of conflicting historical information, a lack of dates and obvious attempts to connect back to the Biblical genealogies.  As with most mythology, the Irish origins contain grains of truth.  Haplogroup R1b, which is predominant in Ireland, has its origins in Iberia (modern day Spain and Portugal).  The McCarthy Group A DNA data can be traced backward in time via STR mutations to their Spanish and Portuguese cousins.  Imagine two brothers at a farewell party on the slopes of the Pyrenees 3,000 years ago.  One brother has decided to go north to seek better fortunes and the other decided to stay behind.  The ancestors of each exist today for us to compare.


   The Irish do have ‘Spanish’ origins.  Some elements of that oral history remained intact over 3,000 years as the Iberian tribe migrated and settled in Ireland.  As with any oral tradition, embellishment can occur, especially when developing a royal pedigree to show divine right.

   McCarthy Group A was not the first Iberian tribe to land in Ireland and certainly not the last.  Group B arrived about 500-1,000 after Group A.  Irish mythology suggests that there were at least four previous waves of immigration to Ireland from the mainland.  The E1b McCarthy ancestors begin to show up around 2,000 years ago with the Roman invasion and the R1a McCarthys are associated with the Norman invasion of Ireland about 900 years ago.

   My next steps are to find my male McCarthy cousins and get them tested.  I’ll look for at least two, one from each of my g-granduncle’s surviving lines.  My McCarthys trace back to Kilmichael Parish in County Cork and my gg-grandfather, Florence McCarthy, has one of those names that repeats throughout McCarthy history.   I look forward to finding out which McCarthy DNA group I belong.

   If you are a McCarthy, please consider DNA testing and joining the McCarthy DNA Project.  Your data will help build a better understanding and a better genetic family tree of the McCarthy groups.  Along the way, we can learn more about our ethnicity and our Irish culture.  You may even want to change your surname back to its original Irish spelling, Súilleabháin (Sullivan), Ceallacháin (Callaghan), Donnchadha (Donoghue), Donnabhain (Donovan) or Mac Carthaigh.

© Origin Hunters & OriginsDNA

Friday, June 15, 2012

Myles Standish: Mayflower DNA


   My genealogy has one Mayflower passenger, Stephen Hopkins.  Seven other passengers are cousins in one manner or another, Doty, Howland, More, Mullins, Standish, Warren and Winslow.  Twenty-four of the Mayflower families have living descendants.  I have collected the y-DNA records for fifteen of them. (For more on this process watch this short video) It was no surprise to find eight R1b Celts and four I1 Scandinavians among them.  But, the three I2a Balkans intrigued me.

   The one name that stood out as I2a was Myles Standish.  Every first grader knows that name.  My first thought was that Myles was descended from a member of the Roman Legions.  Perhaps he was a Scythian or Sarmatian.  I needed to identify the Standish family tribe and when they arrived in England.   If I was lucky, I’d be able to bracket the immigration of his ancestor to the 1st or 2nd century, the height of the Roman conquest.

   As the DNA records started to compile using TribeMapper® analysis, an initial pattern developed showing historic habitation on either side of Hadrian’s Wall.  This was the beginning of a great migration story and potentially the end to the dispute of Myles Standish’s origins.  Researchers have placed Standish’s birthplace as either Lancashire or the Isle of Man.  Based on the data, Lancashire emerges as the most likely location.  There was no genetic indication that the Isle of Man was a possibility.

   If Standish’s ancestors had been conscripted into the Roman Legion, then I would expect their migration pattern to appear scattered like a diaspora.  Fathers and brothers and their descendants would be spread across the Roman empire.  There would be no focus for the data points representing the period 2,000 years ago.

   The actual data points told a different story.  They remained focused.  At the end of the last ice age, about 10,000 years ago, Myles Standish’s ancestors were living in the Balkans.  As the ice receded, they journeyed up the Danube River, a major migration highway, until they reached the upper Rhine.  The upper Rhine was a Neolithic way station for many tribes coming up the Danube or out of Iberia.  The area served as a stopover before continuing over the Alps or down the Rhine.  The Standish tribe chose to follow the Rhine down to the North Sea.


   Between 2,000 and 3,000 years ago, Standish’s ancestors crossed into England and made their way up the Thames to its source.  My theory is that they were pushed ever westward by successive waves of immigrants.  They found Wales to be well populated already and ventured north to where we find the most recent genetic evidence, in Lancashire.

   My initial theory that Standish’s ancestor was brought to England as part of the Roman Legion, to reinforce the troops at Hadrian’s Wall, was wrong.  It is always good to have a theory to work toward, but don’t let preconceived ideas get in the way of new evidence.  Now that we know that Standish’s origins are pre-Roman we can consider that his family is one of the native tribes of Britain.  The most likely Lancashire tribe would be the Setantii, which is a sub-tribe of the Brigantes.

   Each one of our ancestors has a unique migration story to tell.  Their travels overlap with events that we have read about in history books.

   Where did you come from?

© Michael R. Maglio and OriginsDNA

Monday, June 11, 2012

Who's Who in the DNA Zoo


   When I talk to folks about y-DNA, I like to give the haplogroups an ethnic identity.  Rather than just saying that they are R1b, I also talk about their Western European or Celto-Iberian deep ancestry.  This helps them associate their DNA in a historical and geographical context.  It is important to understand that your nationality is just the outside of the onion, with many more ethnic layers beneath.


   I’ll pick on England for second, because they’re an island.  Roughly 10,000 years ago, nobody lived in England.  It was still recovering from the Ice Age.  Over the past 10,000 years, England has seen wave after wave of immigrants and invasions.  It’s only been the last 2,000 years that we can label these new comers as Romans, Vikings, Anglo-Saxons or Normans.  If you consider yourself English, think again.  What is that next ethnic layer?

   If you want to know the answer, I suggest taking a DNA test to get your ancestral origins.  The approximate cultural identities that I use for y-DNA are:

  • C3 - Mongol
  • E1b – Greek / Egyptian
  • G2a – Caucasus / Etruscan
  • I1 – Scandinavian
  • I2 – Balkan / Danubian  
  • J – Phoenician / Semitic
  • N1c – Finn
  • Q1a – Siberian / Native American
  • R1a – Balkan / Slavic
  • R1b – Celtic (most common in Europe)

   I see these haplogroups consistently in Europe.  There are many more, worldwide.  Even these ethnicities are too generalized.  Throughout history, the R1b and I1 folks have shared geography from Iberia to Scandinavia.  It may be easy to describe someone as Celto-Scandinavian, but it is difficult to say Scandinavian-Iberian.  Location based naming conventions are tough to use for nomadic tribes.

   Perhaps you are English and have taken an autosomal DNA test.  As part of the at-DNA test, you get an ethnic population distribution.  It might say that you are 100% Scandinavian.  Now you have peeled back one more layer of your ethnic onion.  What flavor of Scandinavian are you?  This is where y-DNA can help place you in either the R1b, I2, N1c or even Q1a group.

   You could find out that you are R1b Scandinavian (with Celto-Iberian roots) and that more than likely your ancestors entered England as part of the Anglo-Saxon invasion.  One more layer peeled back.  I know that R1b men were among the Anglo-Saxons.  That doesn’t mean that they were a homogenous group.  Perhaps you are more Angle than Saxon or even Jute.

   Many of these nomadic haplogroups traveled the same river highways and lived in the same regions.  Today the genetic groups are thoroughly mixed in every country.  It is difficult to pick a time in history when we weren’t mixed.  History books are full of the great battles between nations.  Where is it written that two tribes co-existed, worked together and built a new common heritage?

   I can count Italian as part of my heritage, with roots in the mountains outside of Benevento.  That definition of me only has a 150-year history.  Prior to 1860, Italy was not a unified country.  3,000 years ago, my ancestors were living on the north side of the Alps in what is now Switzerland.  That doesn’t make me Swiss or does it?  7,000 years ago, my ancestors lived along the Danube River.  Now I’m Danubian.  Before that, we were in the Caucasus Mountains.  I sense a mountain theme going on here.  Perhaps I should call myself Caucasian?  My y-DNA haplogroup is G with origins in the Caucasus and my autosomal test indicates a close relation with the Adyghe or Circassian tribes of current day Russian Georgia.  A rough translation of the word Adyghe means ‘mountaineer who lives near the sea or between two seas’.  The Italian peninsula must have made a great home away from home.

   I could continue to peel back the layers of my ethnicity.  Genetically we could all say that we are African.  Who we really are and what culture we associate with has gotten a bit more complex.  My y-DNA is just a fraction of my identity.  I enjoy the music of Scottish bagpipes while drinking Irish beer or eating a nice slice of lasagna with a glass of German wine.  I have a craving to hike in the mountains, go figure.

Thursday, March 15, 2012

Mapping Your Tribe


If I asked you where your ancestors were last year or 100 years ago, you could probably tell me.  If you have a yDNA or mtDNA test in your hands, you could tell me where your ancestors were 30,000 years ago.


Where were your ancestors 1000 or 2000 years ago?  What events did they witness?  What history did they make?

Join me as we combine DNA and history to Map Your Tribe.

Tuesday, March 27th at 7pm
22 Elm St, Gardner MA – American Legion Post #129

Where did you come from? 

#gDNA

Friday, November 25, 2011

11 - 11 - 11: Day 5 - Favorite New England Ancestors - Part I


In celebration of November 11th, 2011, 11-11-11, I will be writing all month long about my favorite things in groups of 11.

I actually have more than 11 favorites for this category so I will have two installments.

Here are the first set of 11 favorite New England Ancestors:


  • Edward Clark (1622-1710) & Dorcas Bosworth (1622-1681) - [Haverhill, MA]
    • The beginning of my wife's Clark line in America with Viking DNA
  • John Putnam (1580-1662) & Priscilla Gould (1585-1662) - [Salem, MA]
    • Infamous connection to the witch trials
  • John Hoar (1616-1704) & Alice Lisle (1624-1696) - [Concord, MA]
    • Gateway ancestor to royalty
  • William Lewis (1602-1671) & Amy Weld (1620-1673) - [Roxbury, MA]
  • Nathaniel Whiting (1609-1682) & Hannah Dwight (1625-1714) - [Dedham, MA]
  • Nathaniel Colburn (1615-1691) & Priscilla Clarke (1615-1692) - [Dedham, MA]
  • William Frothingham (1603-1651) & Anna (1607-1674) - [Charlestown, MA]
  • James Kidder (1626-1676) & Anna Moore (1630-1691) - [Billerica, MA]
  • Shadrach Thayer (1629-1678) & Deliverance Priest (1644-1723) - [Braintree, MA]
  • Henry Adams (1583-1646) & Edith Squire (1587-1672) - [Braintree, MA]
    • Connection to at least two presidents
  • Richard Sylvester (1605-1663) & Naomi Torrey (1614-1668) - [Scituate, MA]


Though none of these folks came over on the Mayflower, most of them were immigrants.  You could say that they came over on the "Second Boat".

Tuesday, November 15, 2011

Displaying Your Genealogy: The Royal Wall Mosaic


   I’ve spent a number of years telling my children how they are related to the royal families of Europe.  I’ve rattled off famous names and talked about how far back in time each line goes.  I’ve told them that genetically there is a little bit of all these kings and queens in them.  Essentially, I got – “That’s nice Dad.”

   So, in order to get my children more interested in genealogy I needed to get more creative, more visual.  OK, I wouldn’t say that I got as crazy as Richard Dreyfuss sculpting Devils Tower out of mashed potato or Kevin Costner building a baseball diamond in a corn field.  At one point, I think I heard one of the kids say – “Mom, what’s Dad doing?”

   I started printing and cutting and pasting.  I began on a small corkboard, then moved up to a larger corkboard and realized that it still wasn’t enough space.  Then I laid claim to an entire wall in the cellar and the Royal Wall Mosaic was born.


   I printed every generation in a direct line so that the connections were clear.  I scoured the internet for images of as many royal ancestors as possible.  I displayed the royals across the wall from Brian Boru, King of Ireland, at the far left (representing the West) to Alexios Komnenos, Byzantine Emperor, at the far right.  In between were the kings and queens of Scotland, England, France, Spain, Sweden, Germany, Poland, Russia and Hungary.  I tied it all together with bright red adhesive lines connecting all the families.

   Now this had the intended effect.  For days, my kids would go to the cellar and look at the wall to check out the Who’s Who.  I would point at the middle and tell them, “See that guy there.  He sentenced Joan of Arc to death.” or “You know the story of Robin Hood and Prince John?  Well guess what, you are descended from John.”

   My children even started to show their friends.  One friend was quoted, “You have the coolest parents.”

   The point of my story is that your genealogy shouldn’t hide in a book or in a computer program.  Your genealogy wants to live large.  Print your family history as large as you can and paper a wall, sew it into a quilt or turn your ancestors into ornaments and hang them on a real tree.  All your hard work won’t matter if your history is covered with dust.

   Start working on your Mosaic.  If you build it, you never know who might come.

Friday, November 4, 2011

The Connection Wheel: Displaying Your Genealogy


   I’m always looking for a new and interesting way to display genealogical information.  My father-in-law, an art professor and genealogist, was much the same way.  He would sketch linked family trees on six-foot scrolls of paper, each major family connected by a marriage.  I took his idea a few steps further and connected one end of the paper to the other – making a Connection Wheel.


   The letters ‘EKG’ at the heart of the diagram are the initials of my children.  One of my reasons for creating this Wheel was to get them interested in family history by showing them how they are connected.  Each spoke is their connection to a distant direct line ancestor.  Between the spokes are famous cousins that share at least two of those ancestors.  By default, adjacent cousins are also cousins to each other.


How to create your own Connection Wheel:


   First start with a deep genealogy, 10 to 12 generations works well.  I say this a bit tongue in cheek.  Not all of us have found 10 to 12 generations.  I know I haven’t on my own lines, but my children are lucky to have a mother with a great New England family history.


   I selected from my genealogy all of the immigrant ancestors.  These folks work well because they are also the ancestors of a large portion of the United States.  Next, if you haven’t already, research the ancestry of a bunch of famous people.  I have cousin connections for about 200 actors, writers, artists, presidents, and historical figures to choose from.  I narrowed the list by selecting only those cousins with at least two common ancestor links.  The next step is definitely trial and error.   Pick your favorite famous cousin to start.  Look at your narrowed list for all the cousins that are also cousins of your starting person.  Make an educated decision which one should be next either by knowing which ancestors are fairly common or perhaps to show some deeper connection like actors who have starred together or political rivals.  Continue the process of adding puzzle pieces until you have come full circle.  In my case, I have 11 famous cousins in the diagram.  Your diagram could have any number of connections.  Go wild.


   This is about creating engaging visual illustrations of your genealogy to help all generations appreciate their history.


   Try this at home and tell me about your Connection Wheels.