Tuesday, April 29, 2014

Exploring Rollo's Roots: DNA Leads the Way


   It’s been nearly a year since I wrote about William the Conqueror’s DNA.  Based on a study of men with surnames historically associated with William and their corresponding Y-DNA, I concluded that I identified the genetic signature of the first Norman King of England.  Now it’s time to get back to William and more specifically his 3rd great grandfather, Rollo.  To be honest, the 37 marker Y-DNA haplotype that I published is really connected to Richard the Fearless, William’s great grandfather.  Genealogically, the surnames in the study trace back to Richard.  As long as there was no hanky-panky, William the Conqueror has the same Y-DNA as Richard.  What that also means is that Richard has the same Y-DNA as his grandfather, Rollo.

   Based on the work done in my previous paper, the following haplotype is that of William the Conqueror (and Richard the Fearless)-


DYS393
DYS390
DYS19
DYS391
DYS385a
DYS385b
DYS426
DYS388
DYS439
DYS389i
DYS392
DYS389ii
13
24
14
11
11
14
12
12
12
13
13
29

DYS458
DYS459a
DYS459b
DYS455
DYS454
DYS447
DYS437
DYS448
DYS449
DYS464a
DYS464b
DYS464c
DYS464d
17
9
10
11
11
25
15
19
29
15
15
17
17

DYS460
Y-GATA-H4
YCAIIa
YCAIIb
DYS456
DYS607
DYS576
DYS570
CDYa
CDYb
DYS442
DYS438
11
11
19
23
15
15
17
17
36
37
12
12


   There is an assumption, inherent in genetic genealogy, that there weren’t any non-paternal events between the generations that separate Rollo and William and that this haplotype is that of Rollo as well.  One of the goals for this Rollo study is to get more accurate with his haplotype by narrowing the dataset to only those records with 67 markers.  The second goal is to determine Rollo’s haplogroup R SNP.  The best I was able to determine for William was R-P312, which is a fairly high level SNP.  My third goal is to determine Rollo’s origin using my TribeMapper analysis.  Whether Rollo is Danish or Norwegian has been disputed for hundreds of years.

   I picked up where I left off with William.  There were 152 Y-DNA records that made it into the William the Conqueror Modal Haplotype (WCMH).  For each of these records a 67 marker test result and SNP testing result were added to the analysis, where the data was available.  I threw out any record that didn’t have enough data and retained the ones that grouped into a single SNP of R-DF13 (just downstream of R-L21).  Based on these final 25 records, I have identified the 67 marker Rollo Norman Modal Haplotype (RNMH) as follows:

DYS393
DYS390
DYS19
DYS391
DYS385a
DYS385b
DYS426
DYS388
DYS439
DYS389i
DYS392
DYS389ii
13
24
14
11
11
14
12
12
12
13
13
29

DYS458
DYS459a
DYS459b
DYS455
DYS454
DYS447
DYS437
DYS448
DYS449
DYS464a
DYS464b
DYS464c
DYS464d
17
9
10
11
11
25
15
19
29
15
15
17
17

DYS460
Y-GATA-H4
YCAIIa
YCAIIb
DYS456
DYS607
DYS576
DYS570
CDYa
CDYb
DYS442
DYS438
11
11
19
23
15
15
17
17
36
37
12
12

DYS531
DYS578
DYF395S1a
DYF395S1b
DYS590
DYS537
DYS641
DYS472
DYF406S1
DYS511
DYS425
DYS413a
DYS413b
11
9
15
16
8
10
10
8
10
10
12
23
23

DYS557
DYS594
DYS436
DYS490
DYS534
DYS450
DYS444
DYS481
DYS520
DYS446
DYS617
DYS568
16
10
12
12
16
8
12
22
20
13
12
11

DYS487
DYS572
DYS640
DYS492
DYS565
13
11
11
12
12

Based on this modal haplotype and the associated SNP, a broader collection of genetic cousin records were identified to be used with my new TribeMapper analysis (Biogeographical Multilateration).


   This map shows the geographic distribution of Rollo’s cousins.  The large number of points along the coast of Normandy is a good sign.  If the majority of points were in Eastern Europe, I would have to revisit my whole hypothesis about William the Conqueror.  It is best not to try to interpret any relationships until we look at them through the lens of a phylogenetic tree.


   The TribeMapper analysis takes into consideration the mapped location, the tree node connections and the time between common ancestors.  The time is converted to distance based on the demic diffusion migration rate.  The distance is plotted to ‘triangulate’ the geographic location of each common ancestor.  This is a process called multilateration.

   The earliest documented origins for Rollo come from Dudo of Saint-Quentin in 1015 and William of Jumièges in 1060.  Both ‘histories’ were commissioned by the House of Normandy and attribute a Danish origin to Rollo.  Commissioned biographies can border on mythology.   The Norwegian Orkneyinga Saga, from the 13th century, gives Rollo a Norwegian origin. 

   I’ve run the analysis with Rollo’s record as an unknown location.  TribeMapper allows us to back into the location for any unknown point.  What we get is a highly constrained location for Rollo’s ancestor, in the middle of Denmark.  The data then shows that Rollo may have lived within 226 km of that paternal ancestor.  The red circle illustrates the range for Rollo.  This covers the majority of Denmark.  The data also shows that Rollo’s ancestors, going back at least 12 generations were also in Denmark.


   We can give the Norwegians some credit also.  The ancestors of Rollo’s ancestors were Nowegian, with an origin on the west coast of Norway.  Rollo’s ancestors were responsible for multiple branches of migration into Europe.  This includes a back migration into Norway that then went on to invade Scotland.


   This was accomplished with small sample of 65 records for simplification.  Much larger data sets could determine the genetic flow in a greater geographic and chronologic view.  Additional records within the same SNP grouping could result in a more accurate origin for Rollo.  Records that are genetically upstream from the SNP and STR group used, may identify the nomadic migrations prior to the Western Norway settlement.


   I’ve run this simulation multiple times, getting the same results.  I’m comfortable calling Rollo – “The Dane”.

Reference:

Maglio, MR (2014) Biogeographical Origins and Y-chromosome Signature for the House of Normandy  (Link)

Thursday, February 20, 2014

Pushing the Boundaries

Tonight I made a guest appearance on Steve St. Clair's SinclairDNA BlogTalkRadio episode - Pushing the Boundaries of What Can Be Learned from Your DNA.


The episode was recorded live Friday, February 21 (2014).  You can listen to the recording through your computer by using this link - SinclairDNA

Steve and I talked about my recent experience with y-DNA research; Mapping y-DNA, William the Conqueror and a rare R1b group R-L11*.  We'll also talked a bit on the future of y-DNA testing.

Have a listen if you get a moment.  You can even download the show and take it with you.

Monday, February 10, 2014

The Third Brother: A Y-DNA Tale

   If we were to look at the Y-DNA family tree, we would see ancestors and descendants in a genetic sense. Haplogroup B is descended from A and C is descended from B. If we keep going, R is descended from P, etc. Within haplogroup R is SNP R-L11/P310 (R1b1a2a1a ISOGG 2014). There was a boy born somewhere between 3,000 and 10,000 years ago (there is much disagreement on the exact age). This boy was the first male to have this mutation on his Y-chromosome. He essentially became the ‘father’ of all R1b men in Western Europe.

   This R-L11 man had three sons, in the genetic sense, not in the literal sense. The first two sons are R-U106 and R-P312. Their stories are well known (at least in genetic genealogy circles). This is the story of the third brother, the one without a name. I’m going out on a limb in saying that this third branch exists as an independent unidentified SNP. R-DF100 has been identified as belonging to this third branch. Yet, it is too early to determine whether DF100 is the third brother or one of the many nephews (I had to keep the analogy going). Currently it is known as R-L11*/P310* (xU106,xP312), which means that folks on this branch test positive for having the L11 SNP and test negative for the U106 and P312 SNPs. Let’s call him R-x for simplicity. In case you were wondering, a SNP (single nucleotide polymorphism) is a mutation that can mark a branch point on your DNA.

Figure 1 – Three Brothers
   What do we know about R-x? They are a small group, only about 10% of the very large R1b population in Europe. They are still found in substantial numbers in Danelaw areas, the Netherlands, Pomerania, former Prussia and Denmark. U.S. President John Adams is one famous member of group R-x. A group of R-x descendants have created a site (http://www.worldfamilies.net/surnames/r1b1a2a1a) for those who are interested in tracing their family origins further back, have taken a y-DNA deep clade test and tested positive for L11 and negative for P312 / U106. 

   I was approached because of my work done on William the Conqueror’s DNA. The question was asked, what was the frequency of R-L11* (R-x) in the Conqueror study. All of the DNA records that made it into the final paper were R-L21*, which is downstream from R-P312. Unfortunately, for the R-x folks, that meant that no R-x records made it into the William the Conqueror modal haplotype.

   R-x was rare and it piqued my curiosity. I wanted to know how they fit into the bigger picture, where they came from and maybe connect them to a part of history. I’ve had some good success with geographical distribution of y-DNA data based on multiple distance measurements from reference positions (BGM). To start, I collected 26 R-x y-DNA records with close STR marker matches and known or probable SNP matches. Eight of these records were directly from the R1b1a2a1a website group data. The records were processed to determine time to most recent common ancestor (TMRCA). The neighbor-joining method was run on the results to create a phylogenetic tree.

Figure 2 – Phylogenetic Tree – R-L11*/P310* (xU106, xP312)

   Each of these records were picked because they also contained self-reported ancestral origins. The records were mapped based on these origins and a range calculated from the TMRCA was drawn as a radius representing distance to a common ancestor. See “Getting More” for additional details.

Figure 3 – Generalized Migration Flow – R-L11*/P310* (xU106,xP312)

   Migration direction is determined from phylogenetic connections. The orange arrows represent the primary migrations from the South Baltic region starting 2,000 years ago ± 200 years. The destinations for these migrations were into Scandinavia and along the Rhine River. The yellow arrows represent secondary migration events ending about 1,000 years ago. The results validate the R-x group’s origin locations (Pomerania, former Prussia and Denmark) and adds the Rhine River as a secondary origin. This is not the endgame. This just gets us 2,000 years into the past. Additional records need to be identified to push us back another 1,000 or so years. Where were the R-x ancestors before they were in the South Baltic?

   The third brother remains unnamed. Perhaps his name is R-DF100. The SNP hunters, those folks that are finding new SNPs every day, need more R-L11*/P310* (xU106,xP312) samples in order to identify a defining SNP. I’d also love to see better techniques of determining the age of a genetic branch. Someday we will know the name and the birthdate of the third brother.


Reference:
Maglio, MR (2014) Y-Chromosome Haplotype Origins via Biogeographical Multilateration (Link)

© MRMaglio 2014

Wednesday, January 29, 2014

Getting More from Your Genetic Testing Results: Y-DNA Mapping

   Y-DNA testing has only been around for about 15 years and can tell us about our direct paternal ancestry.  It is sometimes criticized for only being able to tell us about a small portion of our genetic history.  I think the critics forget that our mothers have fathers and there are a number of ways to obtain male test subjects to expand Y results across the entire family tree.  In the last few years, there has been a brighter spotlight on autosomal testing and its ability to test a larger portion of our genes.  This may have diverted research attention.  Relatively speaking, y-DNA is still in its infancy and there is much more to be learned.  In addition to our deep ancestral origins dating back over 10,000 years, we should be able to identify our old world homeland and our nomadic ancestor’s migration routes.  It is meaningful to know not only where they lived, but also when they lived to give us clues to their part in history.

   My closest genetic cousins and I share a common ancestor over 1,100 years ago.  With that many years between us, I didn’t spend a lot of time looking for a common surname.  For the last four years, I’ve been working with y-DNA to determine what can be learned beyond cousin matches and distant origins.  I originally tested with the Genographic Project and then transferred my results to Family Tree DNA for an upgrade.  In the time since getting my upgrade to 67 markers, I have received only one match.  This is due to my haplotype being somewhat rare and not a reflection of Family Tree DNA’s ability to provide matches.  I learned that I was part of haplogroup G, from the Caucasus Mountains.   I didn’t learn anything about how the ancestors of my Italian family traveled from Western Asia to Italy.
   I needed to find more cousin matches than the client base that had tested with FTDNA.  Ancestry.com allowed me to enter my y-DNA markers into their DNA section.  I compared my haplotype against the database at Sorenson Molecular (SMGF.org).  I also tried Genebase.com and any other place I could find.  I didn’t locate any cousins.  I did get a good education on what is out there for DNA companies and services.  FTDNA allowed me to transfer my results to Ysearch.org, a free public DNA matching service that they provide.  Ysearch provided much more flexibility.  Where FTDNA would only show me matches with a genetic distance of seven or less, Ysearch allowed me to select the genetic distance.  Without the genetic distance restrictions, Ysearch showed me hundreds of very distantly related cousins.  I’d rather have distant than none.  FTDNA is not trying to be difficult.  They are trying to be realistic and keep matches within genealogical timeframes.  I just needed more.
  While not used consistently, one of the best features of Ysearch is its ability to present the most distant known paternal ancestor (MDKPA) and their origin.  So now, I had cousins and their ancestral origins.  The greater the genetic distance, the closer I got to the Caucasus Mountains.  I mapped my closest cousins and their pushpins created a line from the Alps to the North Sea, directly along the Rhine River.  This was a pattern.  I like patterns.  There is usually a scientific reason for a pattern.

Figure 1 – Mapping Ancestral Origins

   I’ve run a few hundred genetic mapping exercises on the majority of Y haplogroups.  The patterns are consistent.  Our ancestors traveled along rivers and coastlines.  They skirted mountain ranges and crossed bodies of water.  There is always a flow to the patterns, but the science and the why were still missing.  I’ve always been interested in early Eurasian history and have tried to associate it to the patterns in the maps that I generated.  Some maps have places and dates that connect well to notable events.  Other maps raise more questions than answers.  Genetic tests and history alone were not making a complete picture.  I needed to add population genetics, migration models, anthropology and evolutionary biology to my knowledge base.
   Take any  two people on the planet, compare their DNA and you can calculate, approximately, how far back in time their common ancestor lived – time to most recent common ancestor (TMRCA).  Our ancestors were nomadic and traveled about 25 to 30 km per generation or roughly 1 km/year on average.  If a common ancestor lived 300 years ago, then that person’s descendants may have migrated 300 km from the geographic origin of that ancestor.  In the figure below, d1 and d2 represent the origins of two known y-DNA genetic records.  The circles show the distance their ancestors may have migrated.  The intersections are the potential locations of their common ancestor.  In this case, there are two intersections, a1 and a2.  More y-DNA records are required to figure out which intersection is correct.

Figure 2 – Distance to Most Recent Common Ancestor (Bilateration)

   The genetic analysis that I have developed is similar to a navigation technique.  Radio navigation uses two or more beacons with known locations and a measurement of the time it takes to receive a signal from each.  The time is converted to a distance.  A current location can then be identified.  In my method, the “beacons” are the ancestral geographic origins. The “signal” is the TMRCA, measured in years, converted to a distance by multiplying the average migration rate – creating a distance to most recent common ancestor (DMRCA).  A location for the common ancestor can then be figured out by looking at the intersections.  Multiple y-DNA records are needed to determine migration direction and geographic origins of a related set of genetic cousins.  The science is starting to take shape.
  I am G-Z726, which is a subgroup of G-Z725.  At Ysearch or on an FTDNA project you may still see an older naming convention - G2a3b.  As an example, let’s look at 18 of my closest genetic cousins – haplogroup G-Z725, (DYS388=13).  TMRCA data is generated using Dean McGee’s Y-Utility.  The output is turned into a phylogenetic tree and the DMRCA is calculated. 

Figure 3 - Phylogenetic Tree - G-Z725 Sample

Each distance is used to draw a circle that represents the migration range of that ancestral line.  My range (MAG) and the range of my next closest cousin on the tree (BAB) create two intersections on the map.  One point is in Africa and the other is in Eastern Europe.  

Figure 4 - Intersection of MAG and BAB

By adding the range of cousin EBE, the correct intersection representing common ancestor 7 (CA7) is identified.  Pairs of records are mapped to continue the analysis.

Figure 5 - Intersection of BIR and RUF

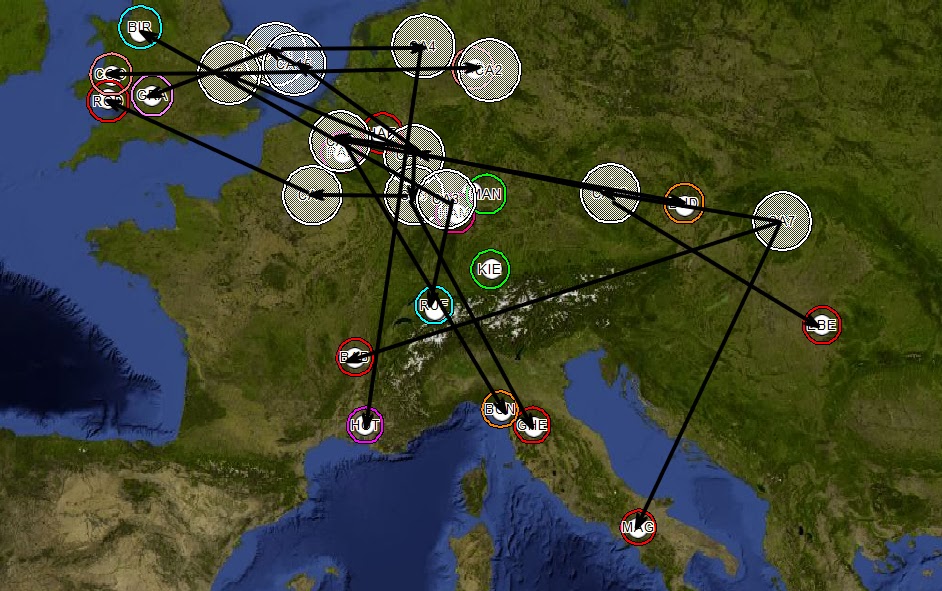
BIR and RUF are another example and they identify common ancestor CA3.  Each record is added until all common ancestors are identified. 

Figure 6 - Common Ancestors Mapped

Connections are drawn based on the phylogenetic tree.

Figure 7 - Phylogenetic Tree Superimposed

Then for simplification, the migration flow is generalized.  Based on the phylogenetic analysis, common ancestor 7 (CA7) is the most distant common ancestor (MDCA) of samples in this example.  The western migration flow has a slight correlation to the Danube River and the North/South migrations have a strong correlation to the Rhine River.  Early attempts at direct mapping of genetic data (Fig. 1) gave similar results based on TMRCA alone.  There was no corroborating evidence of directionality or definitive proof of MDCA.  

Figure 8 - Generalized Migration Flow - G-Z725

   The new methodology that I have developed shows ancestral origins and migration direction.  I call this method biogeographical multilateration (BGM).  It is the geographical distribution of y-DNA data based on multiple distance measurements from reference positions. 
   This method also has the potential to identify the location of a DNA sample when the origin is unknown. For one of my clients, I identified that his paternal ancestor that had immigrated to the United States may have anglicized their name.  The previous name was German and that surname was found predominantly in central Germany.  Applying biogeographical multilateration to my client’s y-DNA results, while leaving the origin as an unknown, indicated a continental European origin within 200km of the city with the highest surname density.
   In the referenced paper, the example haplogroup, I-L22, has an approximate correlation to the Norse/Viking invasions of Britain and identifies a Frisian coast staging area.

Figure 9 - Generalized Migration Flow - I-L22

  We are still in the infancy of what we can learn from y-DNA.  My BGM analysis has room for refinement.  There is enough science out there to help us.  New research is being done at the aggregate population level.  We can apply elements of that research to the individual level.  Biogeographical multilateration has the potential to fill the gap in our knowledge between genealogical records and deep haplogroup roots.  This new tool can give us old world ancestral origins, migration flow and historical timeframes.
   I needed to learn more about my DNA and my origins.  The big testing companies haven’t filled the knowledge gaps that exist.  They are in the business of providing quality test results.  The analysis and tool creation is falling on the shoulders of “citizen scientists”.  Sometimes, you just have to do it yourself.

Reference:

Maglio, MR (2014)  Y-Chromosome Haplotype Origins via Biogeographical Multilateration (Link)