Showing posts with label migration. Show all posts

Wednesday, September 24, 2014

DNA Mysteries: Iberian R1b-V88 in Africa

   When I first heard about R1b in Africa, my immediate assumption was that the predominantly Celtic haplogroup must have been a recent transplant.  I ran some of the V88 haplotypes against the big databases (FTDNA & ySearch) expecting to see matches to European men within the African colonial timeframe.  It wasn’t that easy.  Common ancestor analysis put the R1b Africans (V88) thousands of years removed from the rest of their European R1b cousins.  Where did they come from?  How did they get there?


   I started with the given that the R1b defining mutations (SNPs) occurred in the Iberian Peninsula.  The jury is still out on this hypothesis.  There have been scientific papers for and against Iberian origins of R1b.  My own work (Iberian Origins of R1b) supports an origin prior to the Neolithic expansion.  Could V88 have made a straight-line migration from Iberia to the Lake Chad region of Africa?  Could V88 have crossed the Straits of Gibraltar, travelled across the Sahara, which 7,000 years ago was a savannah well populated with animals for hunting, and arrived at Lake Mega-Chad?  That was my early premise.  I was wrong.

   The distribution of V88 is much larger than any of the scientific papers would indicate.  While I agree with the work that’s been done correlating the spread of V88 with the spread of Chadic languages (Cruciani et al 2010), the Chadic population is only a subset.  Nobody takes into consideration the V88 populations in Europe and the Middle East.  If they do, it is a sideways glance to say were ignoring them because they don’t fit into what we are trying to prove.  If you don’t look at the entire picture, your conclusions will be skewed.

   I wanted the largest selection of V88 Y-DNA records with at least 37 markers tested.  I started with Family Tree DNA projects that had the records SNP tested.  Those haplotypes were run against the ySearch database to identify highly related records with no SNP testing.  The initial gathering of records picked up individuals with SNP M73.  These were removed.  The key differentiator between V88 and M73 was DYS464a&b.  V88 was typically 12,12 and M73 was 15,15.  Thirty-seven or more STR markers are helpful in identifying additional related haplotypes and even more necessary in determining the relationship between records.  Most studies only looks at SNPs or a small handful of STR markers.  This is shortsighted.  Imagine a reference population of 100 records all with the same SNP.  Without enough STR markers you can’t tell whether you are looking at one haplotype with minor 1 or 2 step variations or 100 unique haplotypes.  That’s the difference between a founder event starting with as few as one individual or a group with greater diversity and age.

   My final set of 119 records has at least 37 STR markers, V88 SNP testing or is highly related via STR and has the geographic location of the most distant known ancestor.  The records are processed through PHYLIP to generate a phylogenetic tree.  The phylogenetic tree give a visual depiction of the relationships in the dataset and an approximate number of years back to common ancestors, represented as the nodes between the records.


All of this is very standard genetic genealogy.  I add a twist (Biogeographical Multilateration) by converting the years back to a common ancestor to a distance using Cavalli-Sforza’s migration rate of 1 to 1.2 km per year.  This is enough for me to solve a series of cascading equations giving me the locations of the common ancestors.  Looking back at the phylogenetic tree shows us how all the nodes and locations are connected, essentially the flow of migration.


   The out of Iberia event took place about 7,700 ± 1,600 years ago.  TMRCA calculations have been shown to be very inconsistent.  Some folks use a constant mutation rate and some use rates per marker.  I include a TMRCA to give a relative chronology.  While the majority of R1b is known for its Western Atlantic migrations, V88 took a path along the Mediterranean coast and down the Adriatic.  While none of the V88 records indicated Crete as an ancestral location, it appears multiple times as a common ancestor location.  The data shows Crete as a stepping-stone in the Mediterranean as V88 migrated to the Nile River Valley.  The back to Africa event(s) occurred roughly 5,500 ± 1,000 years ago.


The majority of the Chadic records (Cameroon, Chad and Nigeria) have relatively close genetic connections to individuals in the Middle East (mainly Saudi Arabia).  The Chadic and Middle Eastern records tie back to common ancestors along the upper Nile.  There is a significant lack of information to understand what impact R1b-V88 had on the Nile Valley cultures.  Considering that there was only 1 out of 119 records with an exact Nile River location, I would venture a guess that V88 didn’t integrate well.

   While the V88 back to Africa migration has captured much attention, the data shows a more fascinating event.  There was a V88 re-migration back to Europe from Africa.   The back to Europe event took place about 3,200 ± 1,000 years ago.  Again, Crete played a role as a stepping-stone as V88 entered the Eastern Adriatic region and spread into Central and Eastern Europe.  Someone will probably notice that many of the V88 in Eastern Europe are Jewish and that the date for leaving the Nile region is close to the time of Exodus.  There is nothing in any of the data to indicate that this was the Jewish Exodus from Egypt.  The V88 group in Eastern Europe is closely related and there is phylogenetic evidence to support that this may have been a founder event with a single male or small group of closely related males.  There is no evidence to support that those founders were Jewish when they left Africa.


   By looking at the big picture, including all the data and letting the data illustrate the patterns, we can unravel what appears to be the mysterious appearance of R1b in Central Africa.  Along the way, we can uncover a previously unknown re-migration from Africa to Europe.  Too often haplogroup data is treated as discrete buckets of information living in a vacuum with no interaction to other haplogroups and no internal relationships.  Every DNA record is connected to every other record in a network.  Each haplotype is a vector with location and direction.  The sooner we treat genetic records as a network analysis, the sooner we will solve more DNA mysteries.

Out of Iberia and back to Africa.  Followed by a return to Europe.

Reference:

Maglio, MR (2014)  Y Chromosome Haplogroup R1b-V88: Biogeographical Evidence for an Iberian Origin (Link)


Wednesday, January 29, 2014

Getting More from Your Genetic Testing Results: Y-DNA Mapping

   Y-DNA testing has only been around for about 15 years and can tell us about our direct paternal ancestry.  It is sometimes criticized for only being able to tell us about a small portion of our genetic history.  I think the critics forget that our mothers have fathers and there are a number of ways to obtain male test subjects to expand Y results across the entire family tree.  In the last few years, there has been a brighter spotlight on autosomal testing and its ability to test a larger portion of our genes.  This may have diverted research attention.  Relatively speaking, y-DNA is still in its infancy and there is much more to be learned.  In addition to our deep ancestral origins dating back over 10,000 years, we should be able to identify our old world homeland and our nomadic ancestor’s migration routes.  It is meaningful to know not only where they lived, but also when they lived to give us clues to their part in history.

   My closest genetic cousins and I share a common ancestor over 1,100 years ago.  With that many years between us, I didn’t spend a lot of time looking for a common surname.  For the last four years, I’ve been working with y-DNA to determine what can be learned beyond cousin matches and distant origins.  I originally tested with the Genographic Project and then transferred my results to Family Tree DNA for an upgrade.  In the time since getting my upgrade to 67 markers, I have received only one match.  This is due to my haplotype being somewhat rare and not a reflection of Family Tree DNA’s ability to provide matches.  I learned that I was part of haplogroup G, from the Caucasus Mountains.   I didn’t learn anything about how the ancestors of my Italian family traveled from Western Asia to Italy.
   I needed to find more cousin matches than the client base that had tested with FTDNA.  Ancestry.com allowed me to enter my y-DNA markers into their DNA section.  I compared my haplotype against the database at Sorenson Molecular (SMGF.org).  I also tried Genebase.com and any other place I could find.  I didn’t locate any cousins.  I did get a good education on what is out there for DNA companies and services.  FTDNA allowed me to transfer my results to Ysearch.org, a free public DNA matching service that they provide.  Ysearch provided much more flexibility.  Where FTDNA would only show me matches with a genetic distance of seven or less, Ysearch allowed me to select the genetic distance.  Without the genetic distance restrictions, Ysearch showed me hundreds of very distantly related cousins.  I’d rather have distant than none.  FTDNA is not trying to be difficult.  They are trying to be realistic and keep matches within genealogical timeframes.  I just needed more.
  While not used consistently, one of the best features of Ysearch is its ability to present the most distant known paternal ancestor (MDKPA) and their origin.  So now, I had cousins and their ancestral origins.  The greater the genetic distance, the closer I got to the Caucasus Mountains.  I mapped my closest cousins and their pushpins created a line from the Alps to the North Sea, directly along the Rhine River.  This was a pattern.  I like patterns.  There is usually a scientific reason for a pattern.

Figure 1 – Mapping Ancestral Origins

   I’ve run a few hundred genetic mapping exercises on the majority of Y haplogroups.  The patterns are consistent.  Our ancestors traveled along rivers and coastlines.  They skirted mountain ranges and crossed bodies of water.  There is always a flow to the patterns, but the science and the why were still missing.  I’ve always been interested in early Eurasian history and have tried to associate it to the patterns in the maps that I generated.  Some maps have places and dates that connect well to notable events.  Other maps raise more questions than answers.  Genetic tests and history alone were not making a complete picture.  I needed to add population genetics, migration models, anthropology and evolutionary biology to my knowledge base.
   Take any  two people on the planet, compare their DNA and you can calculate, approximately, how far back in time their common ancestor lived – time to most recent common ancestor (TMRCA).  Our ancestors were nomadic and traveled about 25 to 30 km per generation or roughly 1 km/year on average.  If a common ancestor lived 300 years ago, then that person’s descendants may have migrated 300 km from the geographic origin of that ancestor.  In the figure below, d1 and d2 represent the origins of two known y-DNA genetic records.  The circles show the distance their ancestors may have migrated.  The intersections are the potential locations of their common ancestor.  In this case, there are two intersections, a1 and a2.  More y-DNA records are required to figure out which intersection is correct.

Figure 2 – Distance to Most Recent Common Ancestor (Bilateration)

   The genetic analysis that I have developed is similar to a navigation technique.  Radio navigation uses two or more beacons with known locations and a measurement of the time it takes to receive a signal from each.  The time is converted to a distance.  A current location can then be identified.  In my method, the “beacons” are the ancestral geographic origins. The “signal” is the TMRCA, measured in years, converted to a distance by multiplying the average migration rate – creating a distance to most recent common ancestor (DMRCA).  A location for the common ancestor can then be figured out by looking at the intersections.  Multiple y-DNA records are needed to determine migration direction and geographic origins of a related set of genetic cousins.  The science is starting to take shape.
  I am G-Z726, which is a subgroup of G-Z725.  At Ysearch or on an FTDNA project you may still see an older naming convention - G2a3b.  As an example, let’s look at 18 of my closest genetic cousins – haplogroup G-Z725, (DYS388=13).  TMRCA data is generated using Dean McGee’s Y-Utility.  The output is turned into a phylogenetic tree and the DMRCA is calculated. 

Figure 3 - Phylogenetic Tree - G-Z725 Sample

Each distance is used to draw a circle that represents the migration range of that ancestral line.  My range (MAG) and the range of my next closest cousin on the tree (BAB) create two intersections on the map.  One point is in Africa and the other is in Eastern Europe.  

Figure 4 - Intersection of MAG and BAB

By adding the range of cousin EBE, the correct intersection representing common ancestor 7 (CA7) is identified.  Pairs of records are mapped to continue the analysis.

Figure 5 - Intersection of BIR and RUF

BIR and RUF are another example and they identify common ancestor CA3.  Each record is added until all common ancestors are identified. 

Figure 6 - Common Ancestors Mapped

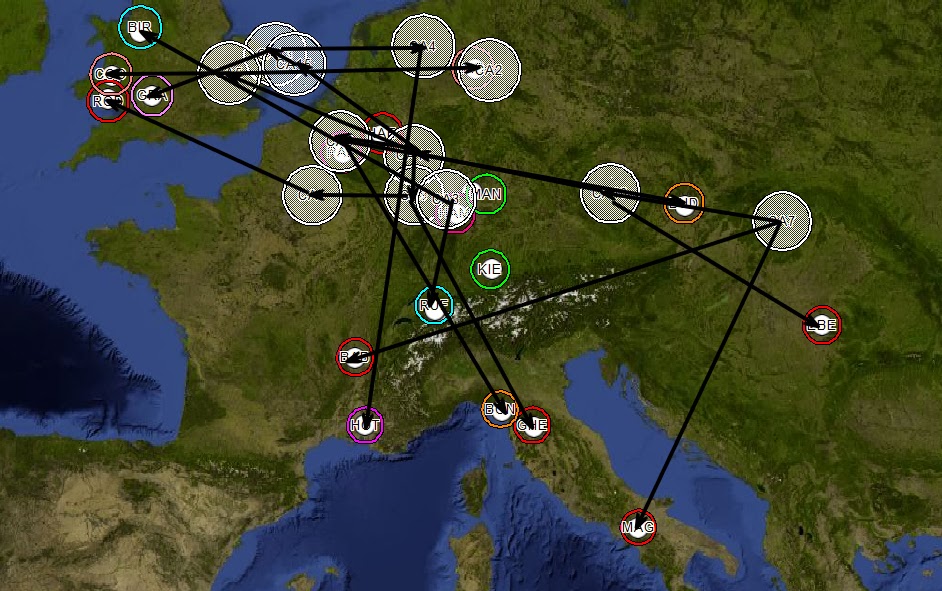
Connections are drawn based on the phylogenetic tree.

Figure 7 - Phylogenetic Tree Superimposed

Then for simplification, the migration flow is generalized.  Based on the phylogenetic analysis, common ancestor 7 (CA7) is the most distant common ancestor (MDCA) of samples in this example.  The western migration flow has a slight correlation to the Danube River and the North/South migrations have a strong correlation to the Rhine River.  Early attempts at direct mapping of genetic data (Fig. 1) gave similar results based on TMRCA alone.  There was no corroborating evidence of directionality or definitive proof of MDCA.  

Figure 8 - Generalized Migration Flow - G-Z725

   The new methodology that I have developed shows ancestral origins and migration direction.  I call this method biogeographical multilateration (BGM).  It is the geographical distribution of y-DNA data based on multiple distance measurements from reference positions. 
   This method also has the potential to identify the location of a DNA sample when the origin is unknown. For one of my clients, I identified that his paternal ancestor that had immigrated to the United States may have anglicized their name.  The previous name was German and that surname was found predominantly in central Germany.  Applying biogeographical multilateration to my client’s y-DNA results, while leaving the origin as an unknown, indicated a continental European origin within 200km of the city with the highest surname density.
   In the referenced paper, the example haplogroup, I-L22, has an approximate correlation to the Norse/Viking invasions of Britain and identifies a Frisian coast staging area.

Figure 9 - Generalized Migration Flow - I-L22

  We are still in the infancy of what we can learn from y-DNA.  My BGM analysis has room for refinement.  There is enough science out there to help us.  New research is being done at the aggregate population level.  We can apply elements of that research to the individual level.  Biogeographical multilateration has the potential to fill the gap in our knowledge between genealogical records and deep haplogroup roots.  This new tool can give us old world ancestral origins, migration flow and historical timeframes.
   I needed to learn more about my DNA and my origins.  The big testing companies haven’t filled the knowledge gaps that exist.  They are in the business of providing quality test results.  The analysis and tool creation is falling on the shoulders of “citizen scientists”.  Sometimes, you just have to do it yourself.

Reference:

Maglio, MR (2014)  Y-Chromosome Haplotype Origins via Biogeographical Multilateration (Link)

The Shape of Words to Come


Tuesday, November 20, 2012

Stephen Hopkins: Saxon DNA?


   As we approach Thanksgiving, it’s a great time to write about our Mayflower ancestors.  So far, I have found two on my wife's side, Stephen Hopkins and Stephen Hopkins.  Ok, that’s really just one, but I have two lines that trace back to him.   This isn’t unusual, estimates put the count of Stephen Hopkins’ descendants at about 2 million Americans.  

   What can Stephen Hopkins’ DNA tell us about his origins and his ancestors?  First, I should say that no one has a sample of Stephen’s DNA.  What we know about Stephen comes from tests completed by his male-line descendants with corroborating genealogical paper trails.  The Hopkins families are members of y-DNA haplogroup R1b, the largest genetic population in Europe.  R1b is often associated with the Celtic and Gallic tribes.  Hopkins’ DNA may be able to shed additional light on his birthplace, extend his genealogy further by tapping into an older family line or tell us about his deep ancestral origins.

   One of the first things I like to do is compare the haplotype, (the numeric markers from a y-DNA test) against a public database like ySearch.org.  The goal is to find other parallel lines of Hopkins with ancestry that predates Stephen.  This would allow us to work forward in time, connecting to Stephen and his father John, breaking through the current brick wall.  Unfortunately, no such records exist.

   What we do get from ySearch is list of genetic cousins and their ancestral locations.  Plotting these locations generates a distribution from Kent to Cornwall across southern England.  The highest concentration of cousins is in the historic Anglo-Saxon kingdom of Wessex.  The current research on Stephen Hopkins has him baptized in Hampshire, the heart of Wessex.
 
   What kind of R1b was Hopkins?  Was he a Celt, a Gaul, an Anglo-Saxon or something completely different?  One way to get close to the answer is to look at his genetic cousins again.  Since R1b is such a large group, it is important to focus on both the haplotype and SNP that defines his R1b subgroup.  The SNP that best defines Stephen is S493, which on the 2012 haplogroup tree is R1b1a2a1a1a2.  With the explosion of new SNPs identification and the rapidly expanding and changing subgroup nomenclature, researchers are advocating the use of the SNP rather than subgroup as a naming convention.  Let’s call Stephen Hopkins R-S493.

   When I take all these genetic cousins and run them through TribeMapper®, a pattern forms.  Ancestors start to pile up on either side of the English Channel and an approximate date of migration emerges.  Here’s where we pull out our history books.  If the date were about 2,500 years ago, I would say this was a Celtic migration.  If the date were 2,000 years ago, I might say these were Gaels fleeing the Romans.   The calculations come out to be about 1,500 years ago, putting this migration in line with the Anglo-Saxon invasion of Britain.

   Why stop there?  What flavor of Anglo-Saxon are we talking about?  Angle, Saxon, Jute?  The great thing about tribe mapping is that we can continuously turn back the clock and get a new picture.  If we find a Danish connection, then we might say Jutes or an association to the Angeln region of Germany, we could say Angles.  We have to be careful as those names and locations were just a snapshot in time when ancient historians catalogued Germanic tribes.  Those tribes, like all tribes, were just passing through.

   Stephen Hopkins’ DNA points to a genetic cluster in modern day Lithuania and Latvia.   This data most closely correlates to the Saxons and their origins on the Baltic coast.  Continuing this process gives us the following migration map.


   The R-S493 data takes us through Finland, Sweden and back to the mainland Europe to the Iberian Peninsula.  This puts the origin of R-S493 in Iberia about 4,000 years ago ± 500 years.

   We can’t be certain that Stephen Hopkins has Saxon DNA.  We can’t even say that all Saxons were haplogroup R1b.  It’s unlikely that they were a single homogenous ethnic group, but the core of the tribe would have had strong familial and genetic ties.  Were Hopkins’ ancestors at the core of this tribe or part of the fringe, picked up along the way?  A broader study of DNA associated with the same places and times would be required to answer that question.

   If we look at the surname Hopkins, its origins are from Hobbes-kin and even further back to the Germanic name Hrodberht.  Stephen Hopkins and his closest genetic cousins are found in the historic Kingdom of Wessex (West Saxons).  Time-wise, there is a correlation to the Anglo-Saxon invasion of Britain.  We can even make a connection to the proto-Saxons along the Baltic coast.  I’m going out on a limb and calling Hopkins a Saxon.

   That Saxon bloodline remained adventurous and served Stephen well as he voyaged to Bermuda, Jamestown and Plymouth colony.

   It’s never obvious where DNA will lead.  Each tribe mapping is an adventure in itself.


© Michael R. Maglio and OriginsDNA

Friday, June 15, 2012

Myles Standish: Mayflower DNA


   My genealogy has one Mayflower passenger, Stephen Hopkins.  Seven other passengers are cousins in one manner or another, Doty, Howland, More, Mullins, Standish, Warren and Winslow.  Twenty-four of the Mayflower families have living descendants.  I have collected the y-DNA records for fifteen of them. (For more on this process watch this short video) It was no surprise to find eight R1b Celts and four I1 Scandinavians among them.  But, the three I2a Balkans intrigued me.

   The one name that stood out as I2a was Myles Standish.  Every first grader knows that name.  My first thought was that Myles was descended from a member of the Roman Legions.  Perhaps he was a Scythian or Sarmatian.  I needed to identify the Standish family tribe and when they arrived in England.   If I was lucky, I’d be able to bracket the immigration of his ancestor to the 1st or 2nd century, the height of the Roman conquest.

   As the DNA records started to compile using TribeMapper® analysis, an initial pattern developed showing historic habitation on either side of Hadrian’s Wall.  This was the beginning of a great migration story and potentially the end to the dispute of Myles Standish’s origins.  Researchers have placed Standish’s birthplace as either Lancashire or the Isle of Man.  Based on the data, Lancashire emerges as the most likely location.  There was no genetic indication that the Isle of Man was a possibility.

   If Standish’s ancestors had been conscripted into the Roman Legion, then I would expect their migration pattern to appear scattered like a diaspora.  Fathers and brothers and their descendants would be spread across the Roman empire.  There would be no focus for the data points representing the period 2,000 years ago.

   The actual data points told a different story.  They remained focused.  At the end of the last ice age, about 10,000 years ago, Myles Standish’s ancestors were living in the Balkans.  As the ice receded, they journeyed up the Danube River, a major migration highway, until they reached the upper Rhine.  The upper Rhine was a Neolithic way station for many tribes coming up the Danube or out of Iberia.  The area served as a stopover before continuing over the Alps or down the Rhine.  The Standish tribe chose to follow the Rhine down to the North Sea.


   Between 2,000 and 3,000 years ago, Standish’s ancestors crossed into England and made their way up the Thames to its source.  My theory is that they were pushed ever westward by successive waves of immigrants.  They found Wales to be well populated already and ventured north to where we find the most recent genetic evidence, in Lancashire.

   My initial theory that Standish’s ancestor was brought to England as part of the Roman Legion, to reinforce the troops at Hadrian’s Wall, was wrong.  It is always good to have a theory to work toward, but don’t let preconceived ideas get in the way of new evidence.  Now that we know that Standish’s origins are pre-Roman we can consider that his family is one of the native tribes of Britain.  The most likely Lancashire tribe would be the Setantii, which is a sub-tribe of the Brigantes.

   Each one of our ancestors has a unique migration story to tell.  Their travels overlap with events that we have read about in history books.

   Where did you come from?

© Michael R. Maglio and OriginsDNA